Who Makes More Money - Monte Carlo Simulation?
I recently came across the following PDF University of Missouri Employee Salaries. 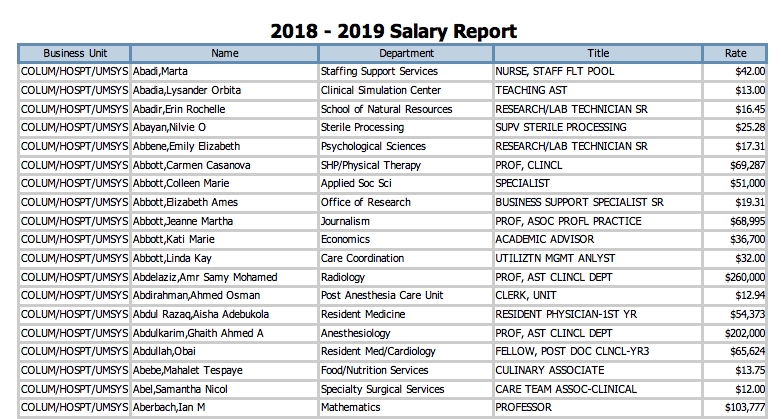
This PDF contains salary information for over 20,000 University of Missouri employees. I wanted to see if I could accomplish the following:
- Parse the PDF into a format that I could analyze using Python
- Using each employees first name and/or middle name, make a “guess” on their gender
- Use a statistical test to determine whether a certain gender makes more money on average
Part 1: Parsing the PDF
I used the following notebook to parse the PDF, Parse PDF. To start I used the library pdfminer to convert the pdf into a text file. This process can be seen below:
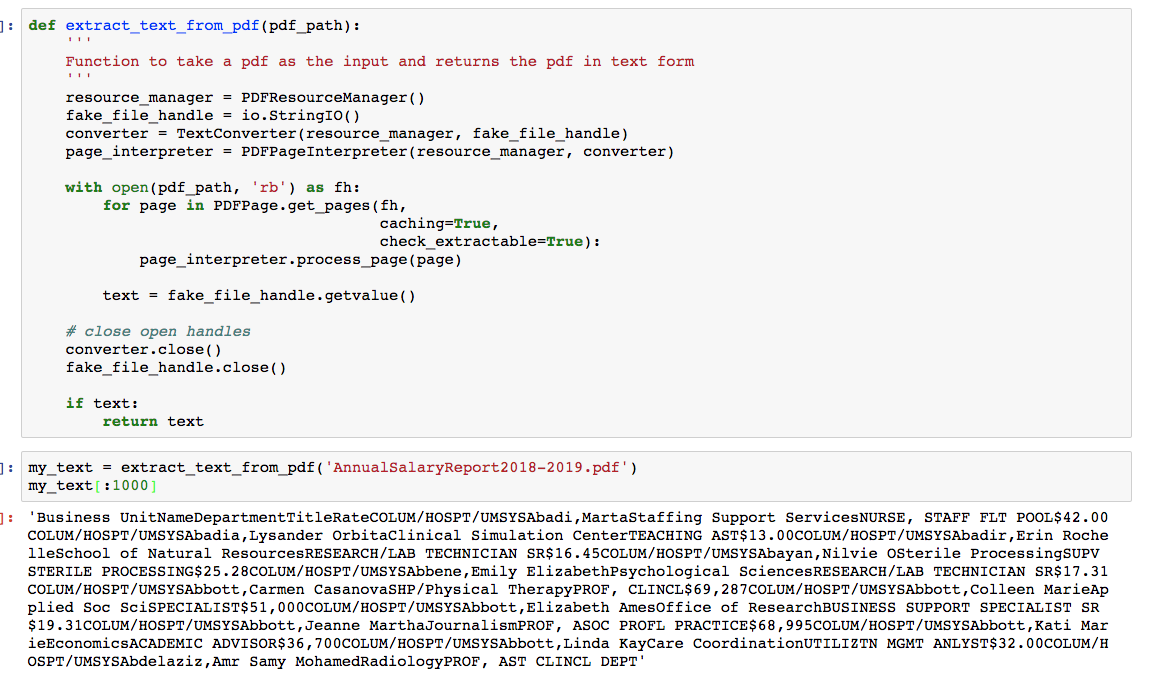
After converting the PDF to a text file, I needed a way to split the text file into the individual rows.

I ended up making a split based on the Business Unit column. I know that this column is going to be consistent for all the employees at each of the 4 campuses (Columbia, Kansas City, Rolla, St. Louis). This led to having elements that looked like the following: 
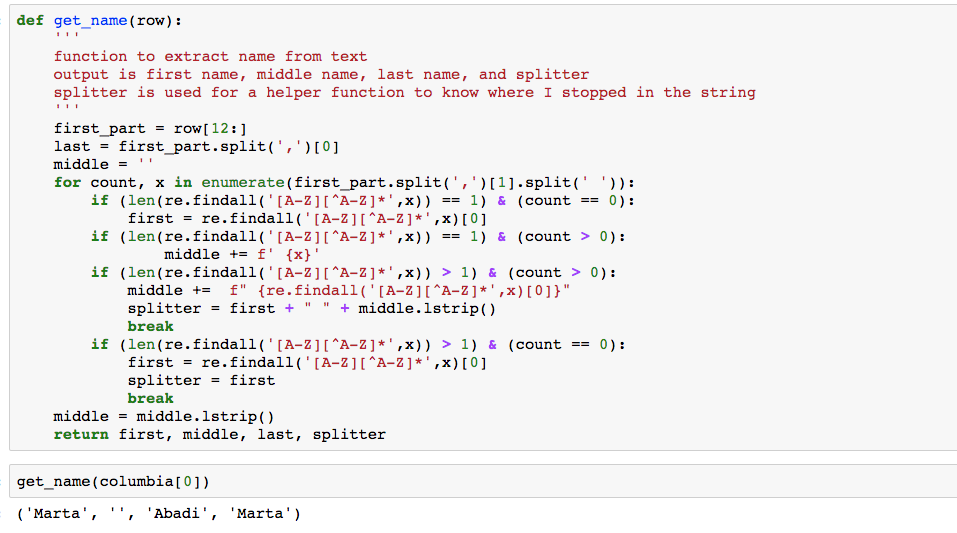
I next wrote a function to extract the first, middle (if applicable), and last name from this string (which can be seen below). I started with grabbing the last name because this was easiest. The last name was the first element after I did a split on the ,. In this case it was Abadi. Grabbing the first and middle name proved to be much more difficult. This was mainly driven by people not always having middle names and sometimes having multiple middle names. I wrote a series of conditional statements and using regular expressions to handle the majority of these edge cases. The regular expression is looking for cases where there are multiple capital letters in a single word. For example MartaStaffing meets this condition. I am looking for these cases because this is where the name ends and the department for the employee begins. The function returns 4 outputs:
- first - the employees first name
- middle - the employees middle name (could have multiple middle names or even no middle names)
- last - employees last name
- splitter - the last part of the employee first and/or middle name. This was used in the next function to know where in the string we stopped parsing.
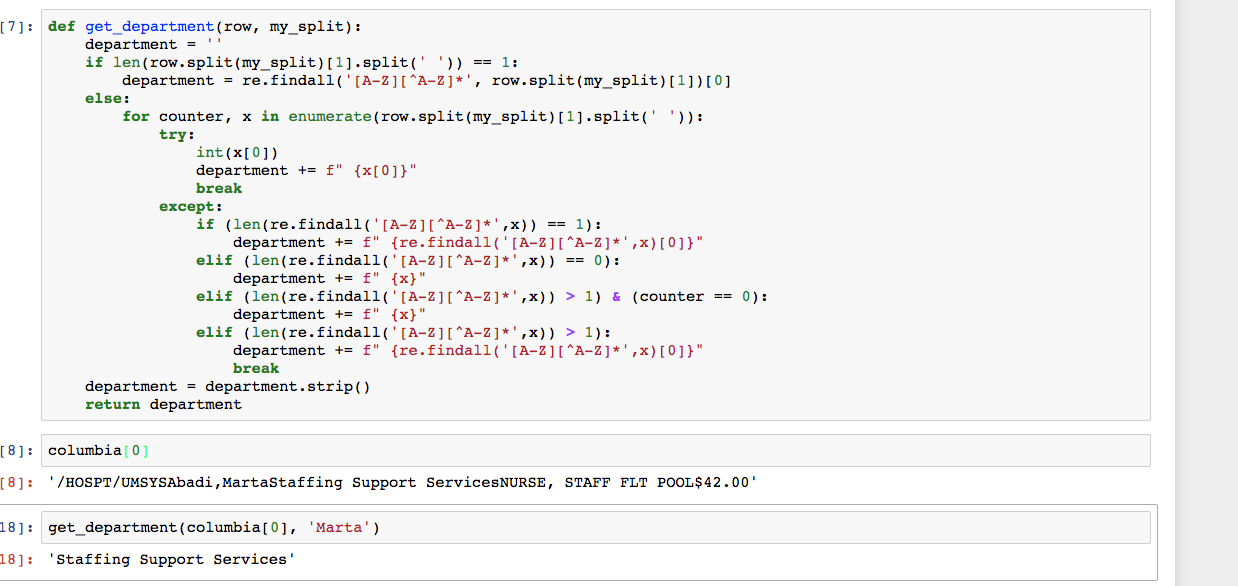
Next I made a function get_department. This function takes where we left off on the previous step (grabbing the name) and using a regular expression looks for when we start getting all capital letters. All the text to the left of all the capital letters is the department. We can see an example of this below.
Finally, I grabbed the employees job title and their respective pay rate. For this I did not have to use a regular expression, but instead was able to do a split based on the $.
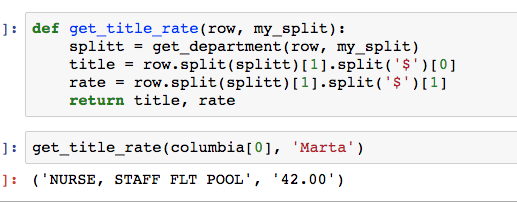
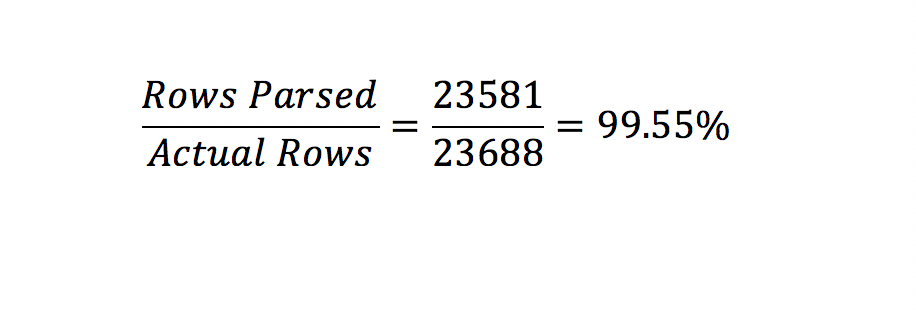
I then repeated this process for the 3 other locations (Kansas City, Rolla, and St. Louis). I ended up with 23,581 rows in my dataframe. You may have noticed that I had a try and except statement in the get_department function. This was due to some edge cases and misspellings in the pdf. I counted there to be a total of 23,688 rows in the original pdf. This process was able to successfully parse 99.55% of the rows in the pdf. The notebook for parsing the pdf can be found here.
My dataset then looked as follows 
The Rate column was a string and there was a mix of hourly rates and salary rates. I made the rate column a float and added a new column for hourly salary and my dataframe looked as follows. The notebook for accomplishing this can be found here.

Now that the dataset was relatively clean, I am ready to start with the EDA.
Part II: EDA
I started by looking at what the average salary and hourly rate for employees at each of the four campuses.
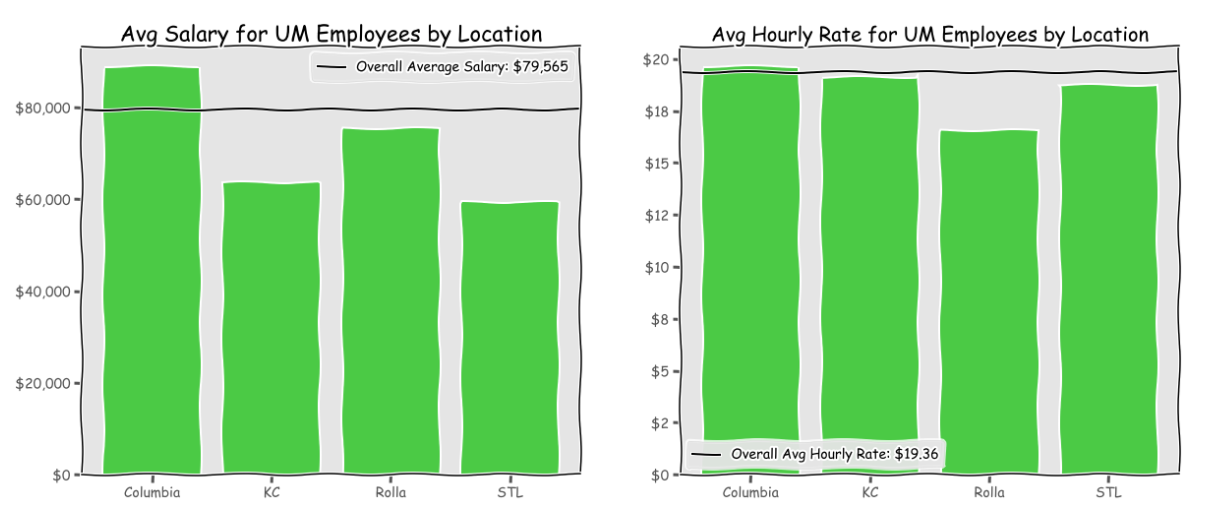
Salaries for employees in Columbia are higher than the other campuses. This could be driven by the fact that there is a hospital at the Columbia location and hospital employees typically are paid on the higher end. We see that hourly rate for employees is also highest in Columbia.
Next I was curious what departments have the highest salaries. I made a bar plot showing the top salaries by department.
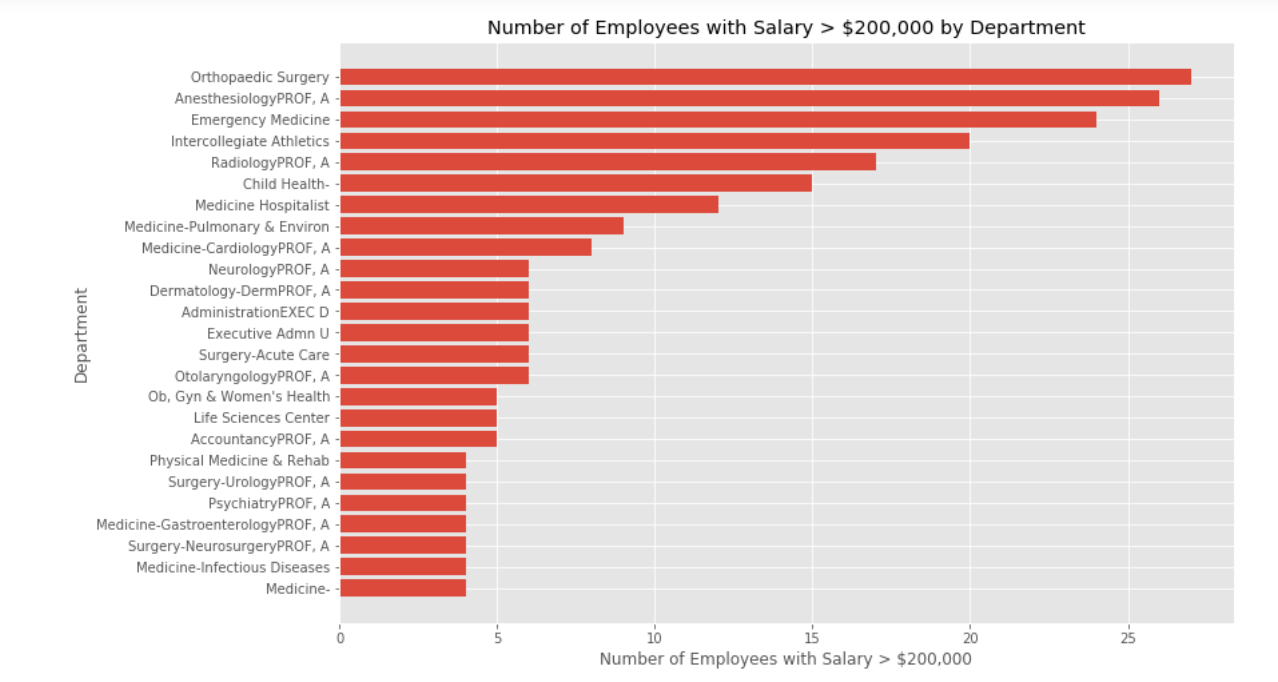
The top paying departments are medical fields and sports. This further supports the idea that Columbia is the highest paying campus due to having a hospital on campus and having the biggest athletics program of the 4 campuses.
Next I used the gender guesser to make a guess what an employees gender is based on their name. This library uses a corpus of 40,000 first names and then makes a guess what the gender is based on this corpus. The library returns 6 options when a name is put in (unknown, androgynous, male, female, mostly_male, mostly_female). If the first name did not return male or female I then would check the middle name to see if that could get a better result.

The gender guesser was not able to find all names, as we can see above, and I’d like to stress using a program to guess what someones gender is based on their first and middle name is not an ideal way to do this. With that being said, I’m going to continue to do this because I’m using this to show off a process (parsing a PDF and using a Monte Carlo Simulation) vs proving one gender is or not paid more or less (due to the uncertainty of the process of guessing genders).
Next I looked at the average salary based on the guessed gender.

We see the average salary for females is less than average male salaries. This leads to more questions - is the difference statistically different and what does the distribution look like.
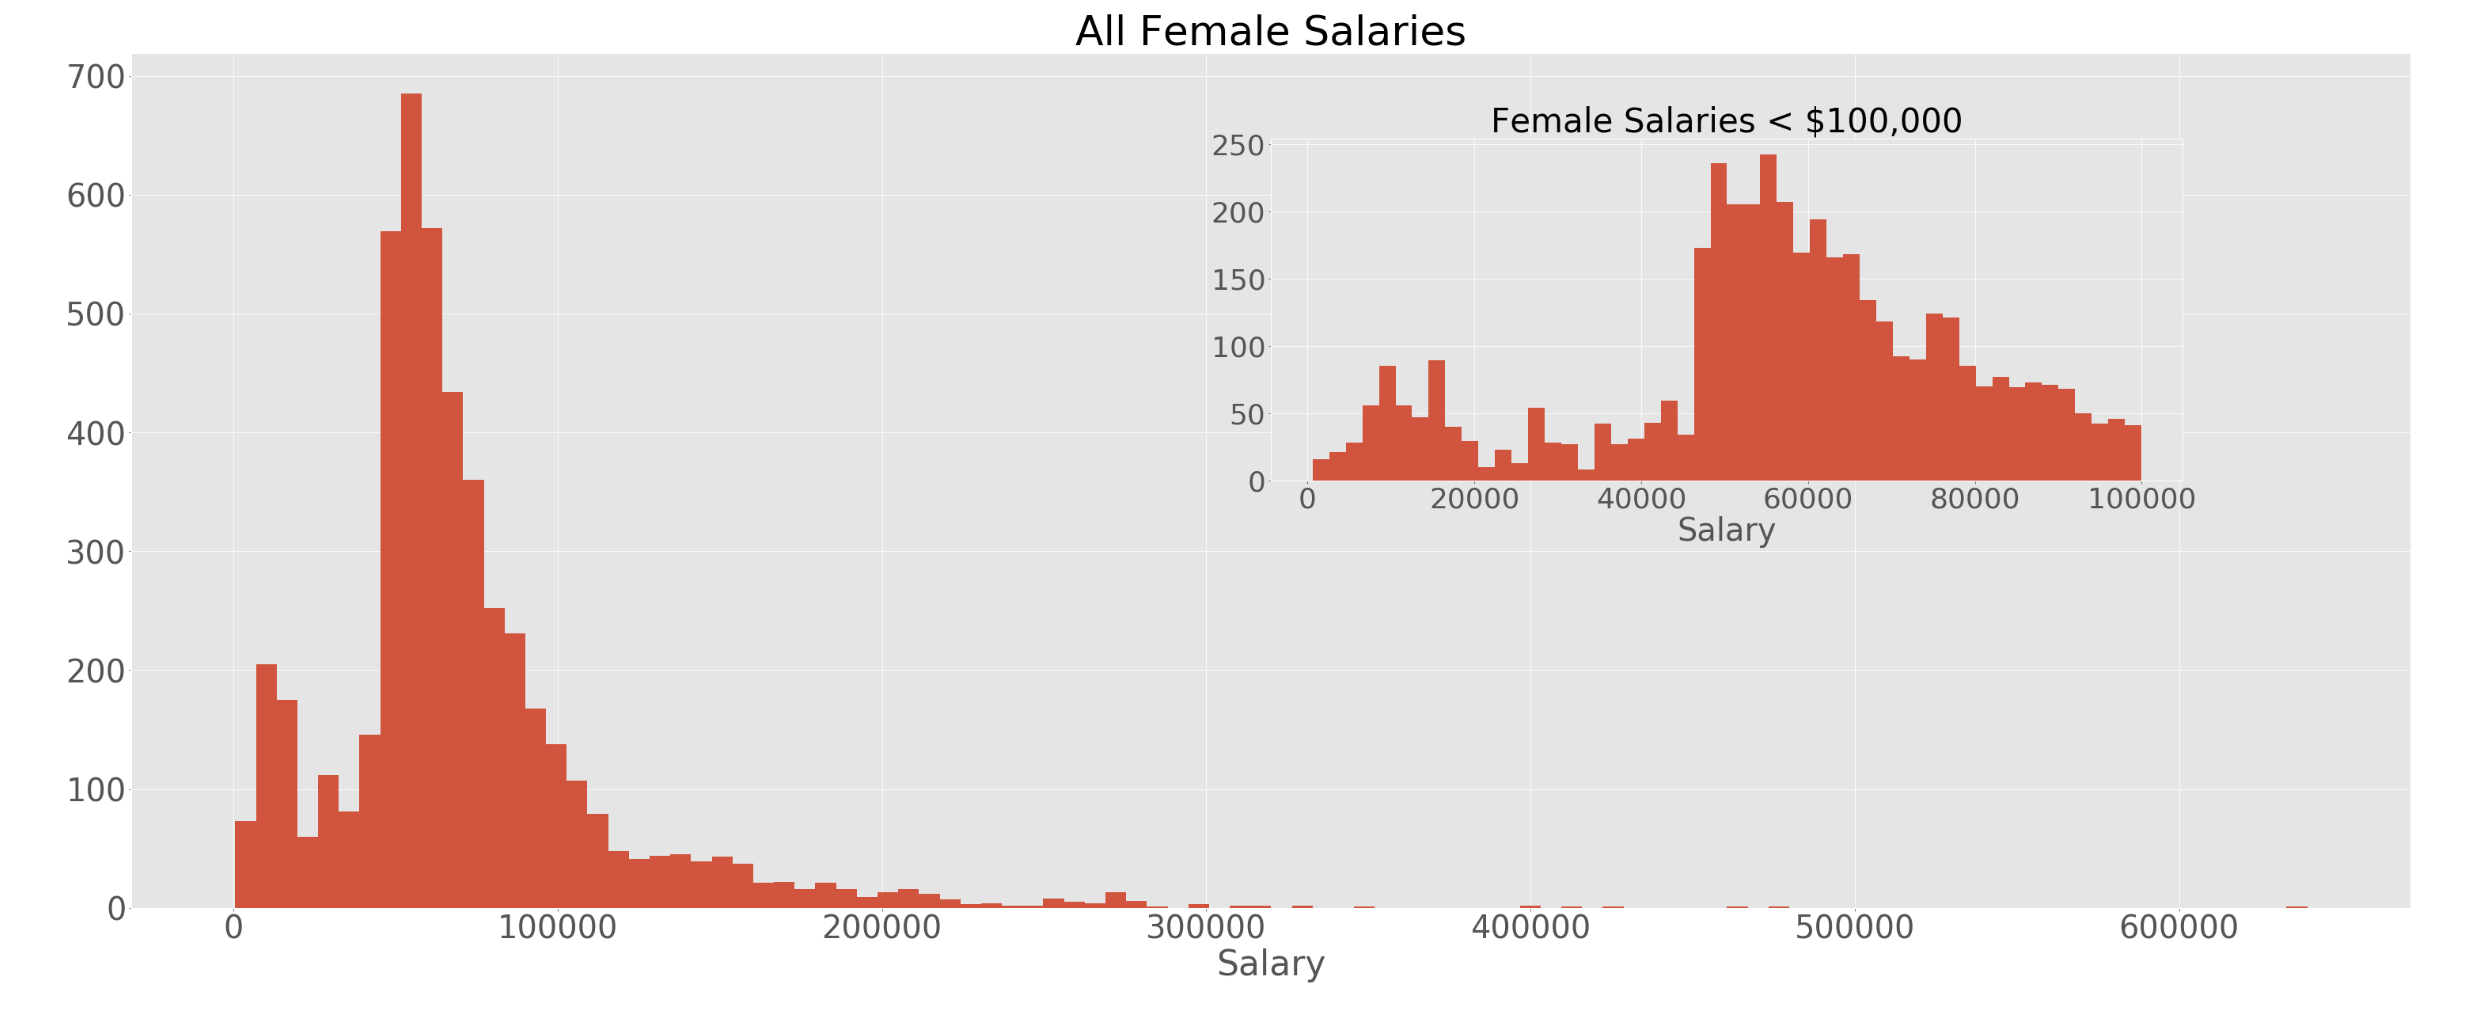
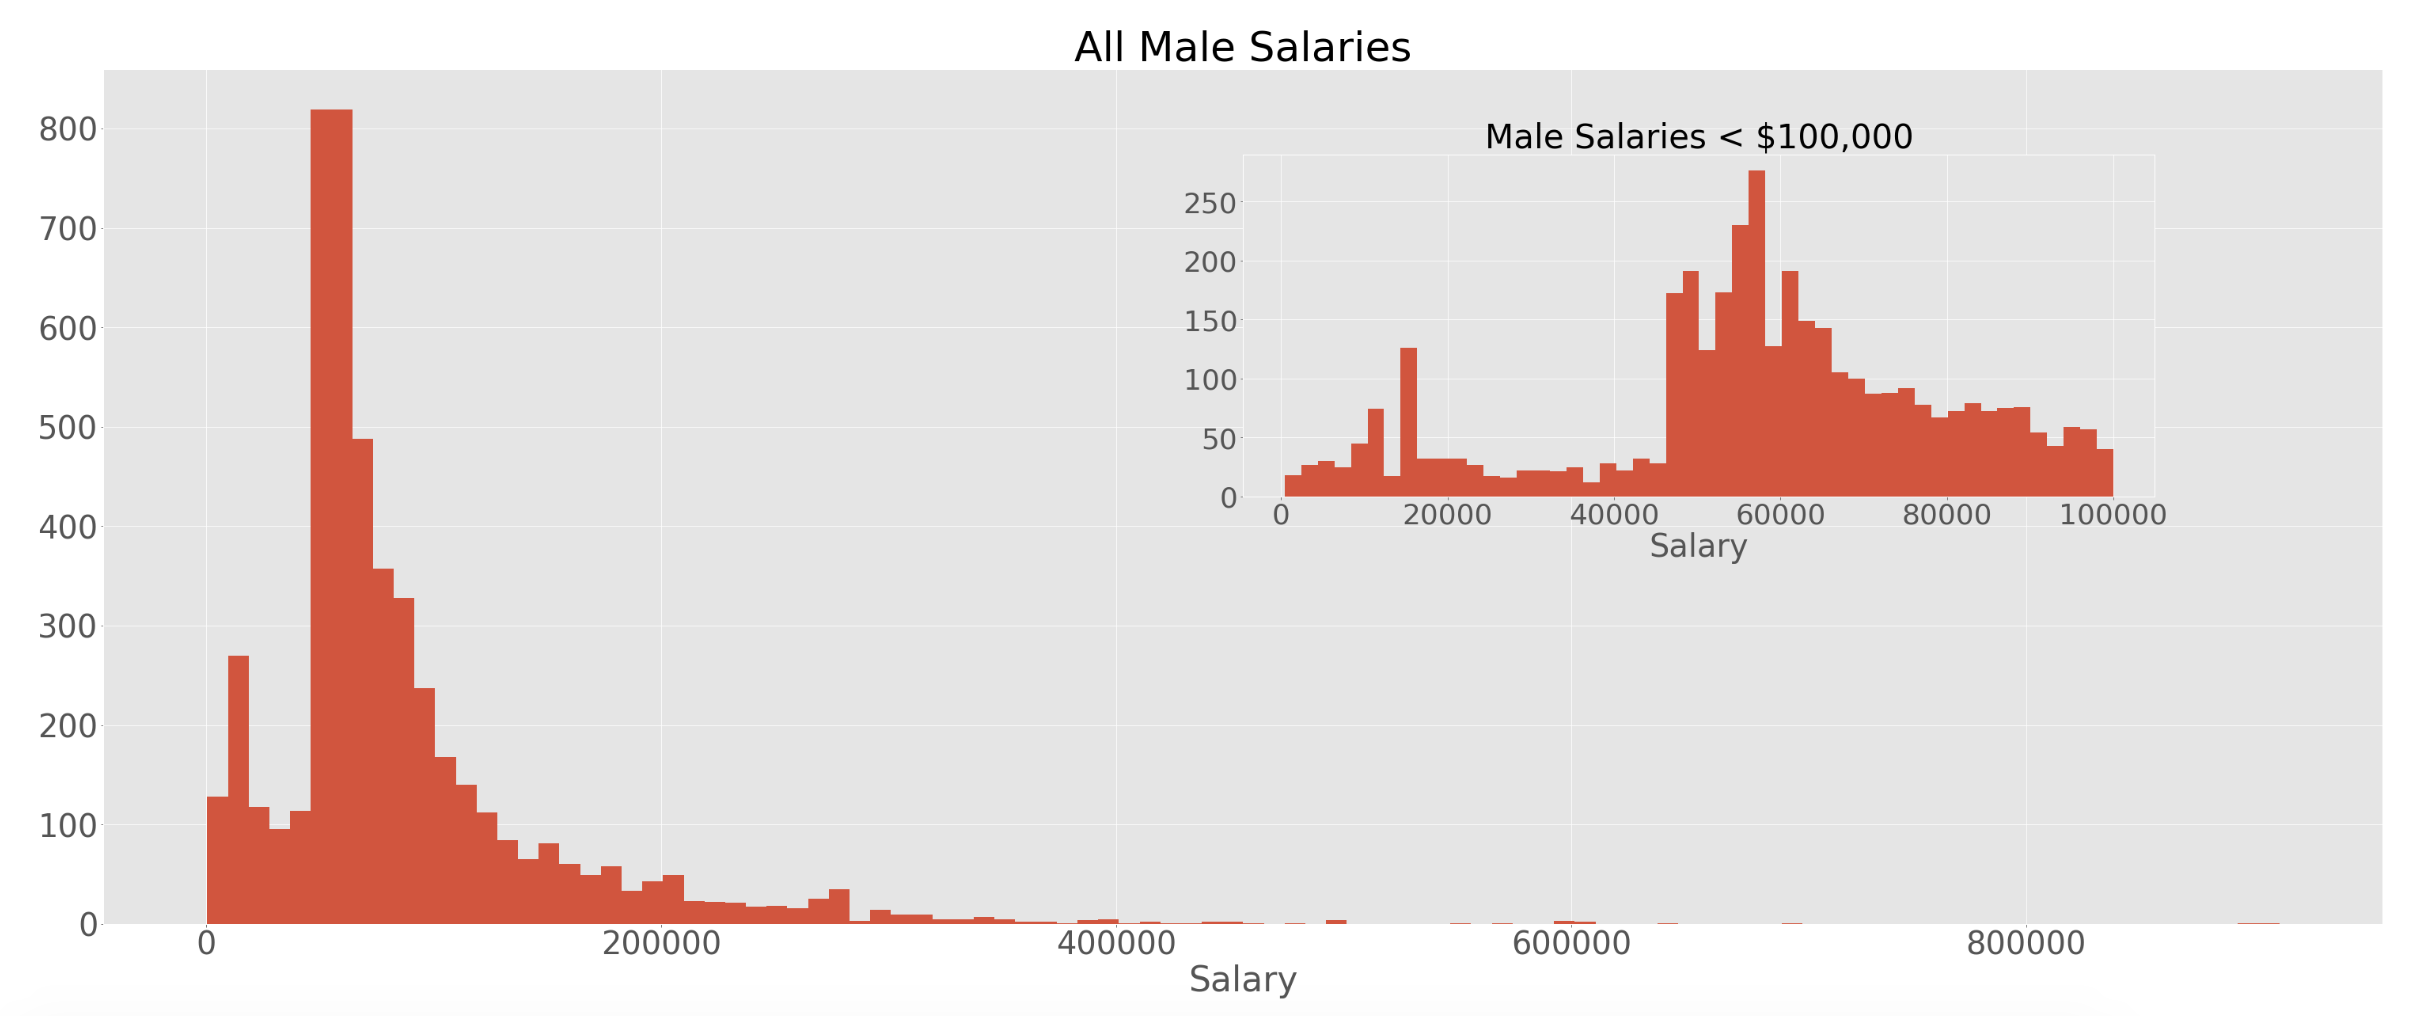
I started with looking at the distributions of the two groups as this will help me decide what kind of hypothesis test to run. Since these distributions are both highly skewed and non-normal, I will not be able to run a T-Test to test statistical significance. Something that caught my eye was the peak at the beginning of both distributions. I decided to zoom in on salaries <$100,000. We see we have a peak at <$25,000. This was driven by Adjunct Professors, there were 806 of them in the dataset and they had an average salary of $11,740.
Part III: Statistical Testing
I’m now ready to begin my statistical test to see if the difference in salaries between the 2 groups is statistically significant. Like I mentioned earlier, I will not be able to do a T-Test due to the data not being normally distributed. I am instead going to try a non-parametric test.
One possible test I could run is the Permutation Test. The Permutation Test will determine statistical significance by taking every single combination from the 2 samples.
First I wanted to see how many possible combinations there are. There are 4,989 males that have a salary and 4,962 females that have a salary (for a total of 9,951).

This means that I have a huge amount of possible combinations. So large in fact, that scipy was unable to calculate it. I do not have the computing power and this is way too many possible combinations.
I am instead going to run a Monte Carlo Simulation. A Monte Carlo Simulation runs a large amount of combinations, but not all of them, and thus is able to provide confidence in the results of the test while being more computationally efficient then Permutation Testing. Starting out with Monte Carlo Simulation, like all statistical tests, I need to state my null and alternative hypothesis.
Null Hypothesis: The average salary of men is less than or equal to the
average salary of women
Alternative Hypothesis:  The average salary of men is greater the average
salary of women

I ran the above for loop for my Monte Carlo Simulation. I took 1,000,000 samples from the original dataset. Of those 1,000,000 samples I took the mean of each and took the differences of the two means. Then compared to see if the mean was larger then my original difference between male and female salaries.

The idea is that if 50% of my 1,000,000 samples have a mean difference larger then my original difference I would say that this happened by chance, however if only 1% of the 1,000,000 samples is greater than the original mean I am really confident this difference did not happen by chance.
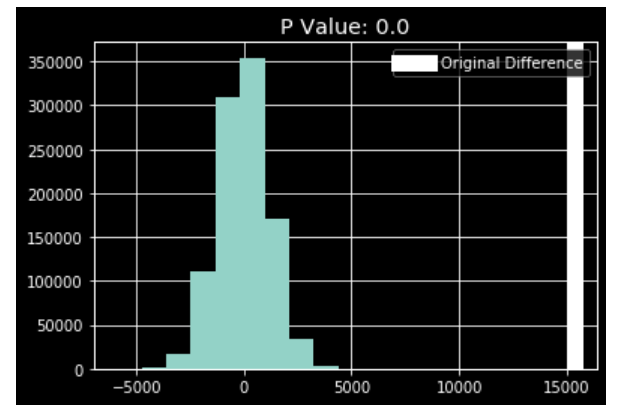
Above is the distribution of the sample differences and the white line on the right is the original difference. I get a P-Value of 0, this means of the 1,000,000 samples that I randomly selected not a single one had a sample mean difference greater than 15,000. I am very confident that the results of the original sample difference did not occur by chance.
To conclude - due to having a P-Value of 0, I can reject my null hypothesis and conclude that people with a guessed gender of male on average are paid more money than people with a guessed gender of women at the University of Missouri. This is, again, with the huge caveat that coming up with gender based on first and middle name is not a perfect process in identifying someones gender.
If you made it this far, thanks and let me know if you have any questions - jherman1199@gmail.com