Exploring Presidential Candidate Funding
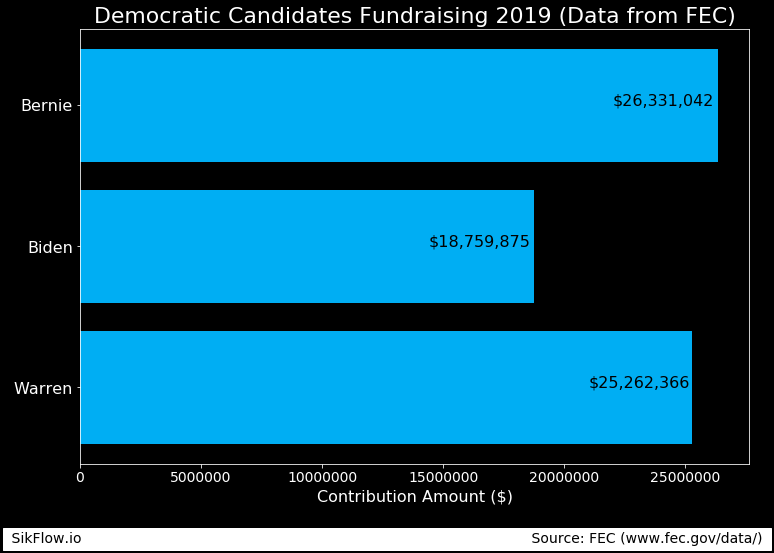
I recently came across this dataset from the FEC that had presidental candidate funding. I downloaded funding from Bernie Sanders, Joe Biden, and Elizabeth Warren. After downloading the dataset I first wanted to see how much each of the candidates had raised in 2019.

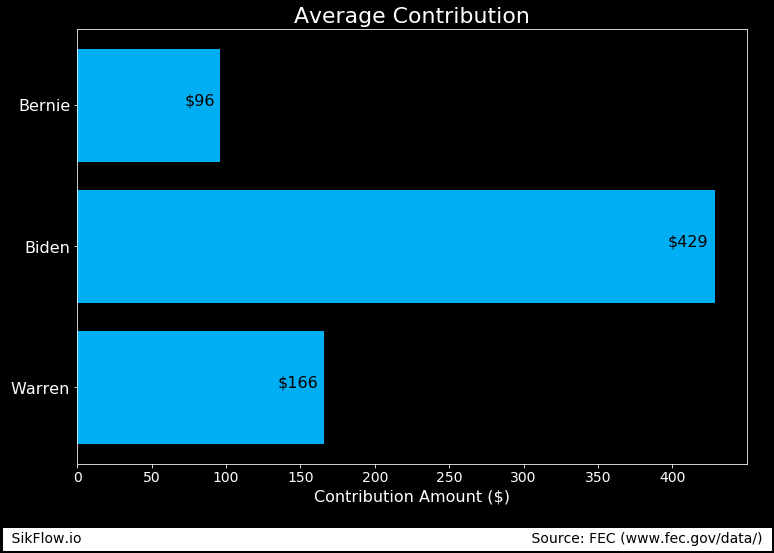
Year to date - Bernie has raised slightly more money than Warren, with Biden in third place overall. Bernie has made it a point in the past to make it be known that his supporters donate less on average than other candidates. Lets see if that is the case with this data.

We see that Bernie does in fact have the lowest average donation and Biden has far and away the highest average donation. Next I want to look at how the donations have changed over time.

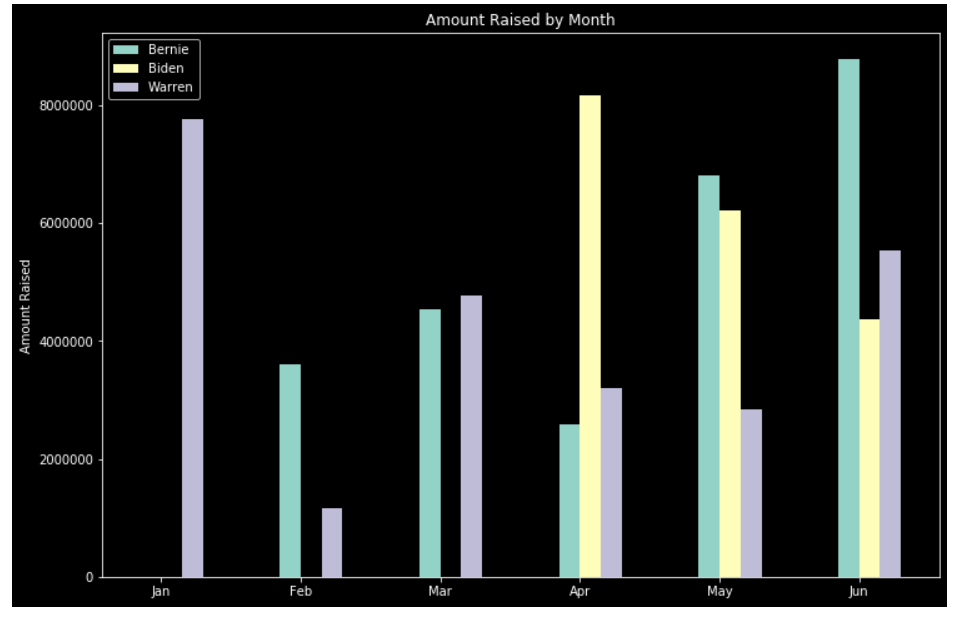
We see that Warren has donations starting in January, while Bernie does not have donations until Februrary. Biden has doneations starting in April. It is very difficult to see who has the most funding in May and June, when all 3 candidates have data. Next I will look at the contributions by month for each of the 3 candidates.

We see that Bernie had the best May and June of the 3 candidates. Now lets see how each of the candidates are doing in each state. Does one candidate have more contributions than other candidates in the majority of US states?
This map was constructed using Folium. The map is interactive - you can zoom in/out and the legend is draggable. We see from the map that Bernie (blue colored states) make up the majority. There are 28 states where Bernie has received the most funding. Biden has 20 states where he has received the most funding. Warren has 2 states where she has received the most funding (Massachusetts and Rhode Island).
Next Steps
I will next attempt to predict who will have the most funding at the end of the year using time series forecasting.