How much is a NHL Draft Pick Worth?
The NFL has a famous chart for quantitatively assigning a value to a draft pick (NFL Draft Pick Chart). Could something similar be made for hockey to assign values to NHL draft picks?
The Data
I scraped data NHL draft data from the 2000 draft to the 2010 draft from Elite Prospects. I collected player statistics from 2,741 players that were drafted during this time. To normalize the data, I only grabbed players that were drafted in the first 210 picks, as the 2010 draft only had 7 rounds and previous drafts had more rounds. I am also going to be using points per game to compare players, so I am going to limit my exploration to only forwards. This left me with 1,324 players to analyze.
Exploration
I first looked at the total points by draft class.
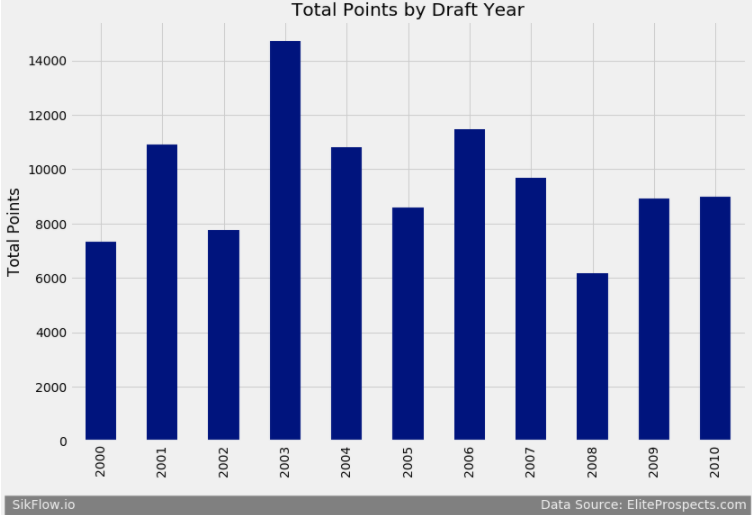
We see there is a little fluctuation in the total points by draft year. Now I want to see what percentage of players drafted played in the NHL.
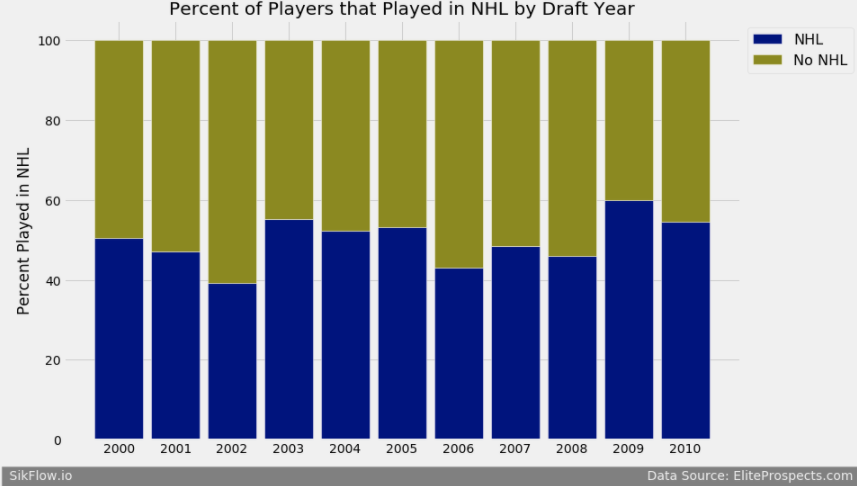
We see that the number of players that play in the NHL varies between 40% and around 60%. Now I am going to see how the Percentage of Players varies by the round they were drafted.
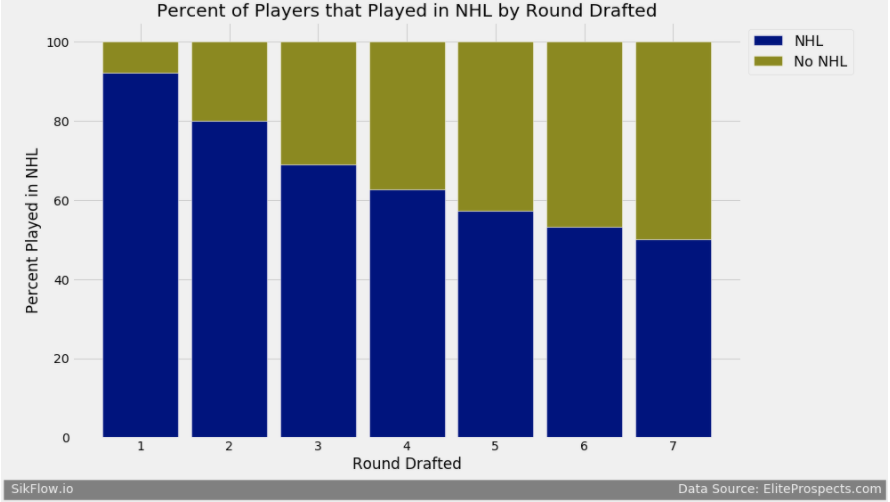
We see that players drafted in the first round over 90% end up playing in the NHL, while players drafted in the 7th round only about half end up playing a single game in the NHL. Now that we looked at who makes the NHL, lets look at who is most successful in the NHL. To calculate success I am going to use points per game as my metric. First I will look at points per game by round drafted.
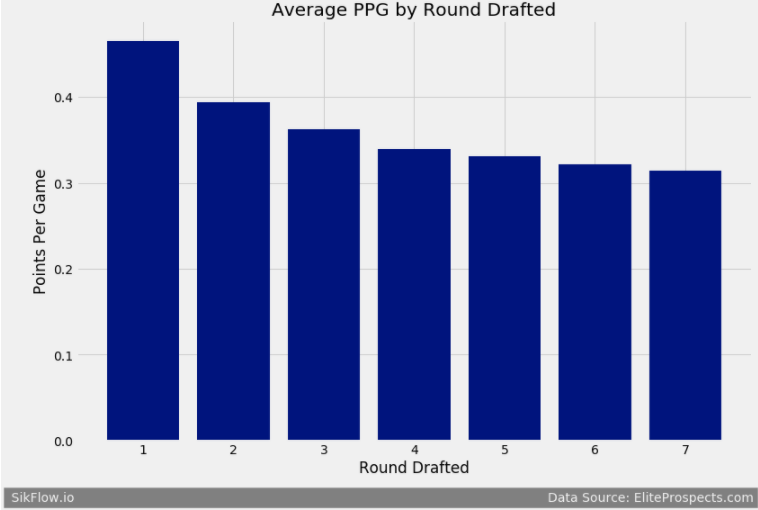
We see there is a steep decline in points per game after the first round. This decline continues all the way to round 7, however after round 4 the decline is very minimal. Now I am going to see how points per game changes based on pick in the first round.
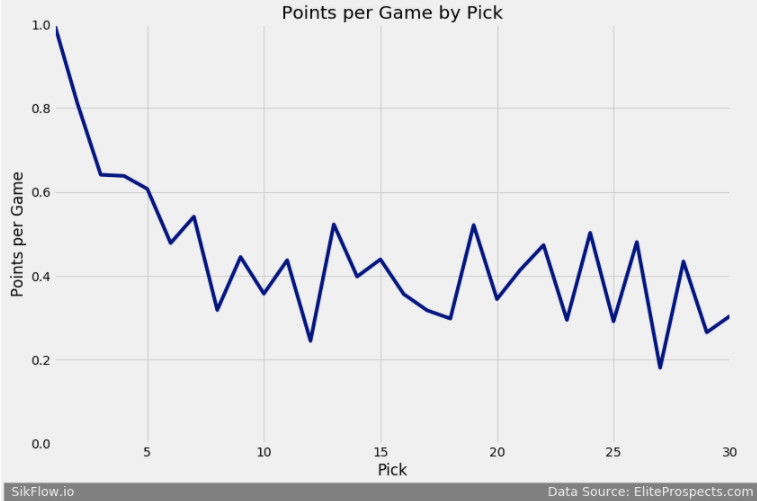
After the first pick the PPG dips down significantly. We see a little bit of a plateau between picks 3 to 5, after pick 5 it looks like white noise all the way to pick 30. This tells me that after pick 5 there is a lot of randomness in selecting players. If given the opportunity, trade up for a top 5 pick and if possible trade up for the number one overall pick.
Modeling Pick Importance
We see that earlier picks are more valuable, but just how much more valuable are they? To start I built regression model where each pick was treated as a categorical variable. I then plotted out the coefficient for each pick.
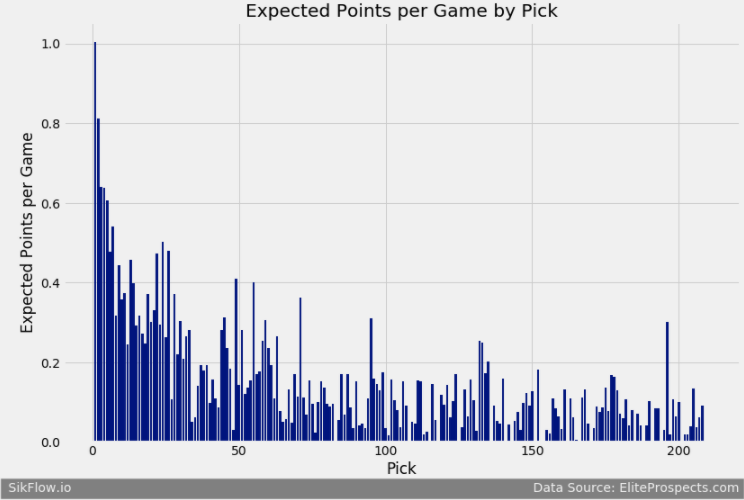
We see that the expected points per game decreases rapidly after the 1st selection and is very random after the first 30 selections. This does not incorporate the risk of the selection, we previously saw that picks in the later round have fewer players that make the NHL. To incorporate the risk of the selection, I am going to divide each coefficient (commonly referred to as the T-Statistic).
\(T Statistic = \frac{coefficient}{standard error}\)

We now see that the first overall pick is significantly higher than every other pick, this is because there is significantly more risk with future picks. For a comparison, lets look at the number one overall picks during this time
| Player | PPG |
|---|---|
| Sidney Crosby | 1.28 |
| Alex Ovechkin | 1.11 |
| Patrick Kane | 1.05 |
| Steven Stamkos | 1.04 |
| Ilya Kovalchuk | 0.95 |
| John Tavares | 0.94 |
| Taylor Hall | 0.90 |
| Rick Nash | 0.76 |
Most of these players ended up as legitimate superstars (as a reminder Rick Nash had injury problems). Now lets compare this to the 2 overall picks
| Player | PPG |
|---|---|
| Evgeni Malkin | 1.19 |
| Dany Heatley | 0.91 |
| Tyler Seguin | 0.86 |
| Jason Spezza | 0.84 |
| Eric Staal | 0.82 |
| Bobby Ryan | 0.67 |
| James Van Riemsdyk | 0.65 |
| Jordan Staal | 0.56 |
We see that besides Malkin, the majority of of #1 draft picks having significantly more points per game than #2 overall draft picks.
Finally, to smooth out the randomness of the normalized expected points per game I am going to fit a polynomial regression to the data. I am using a polynomial regression due to the relationship not being linear.
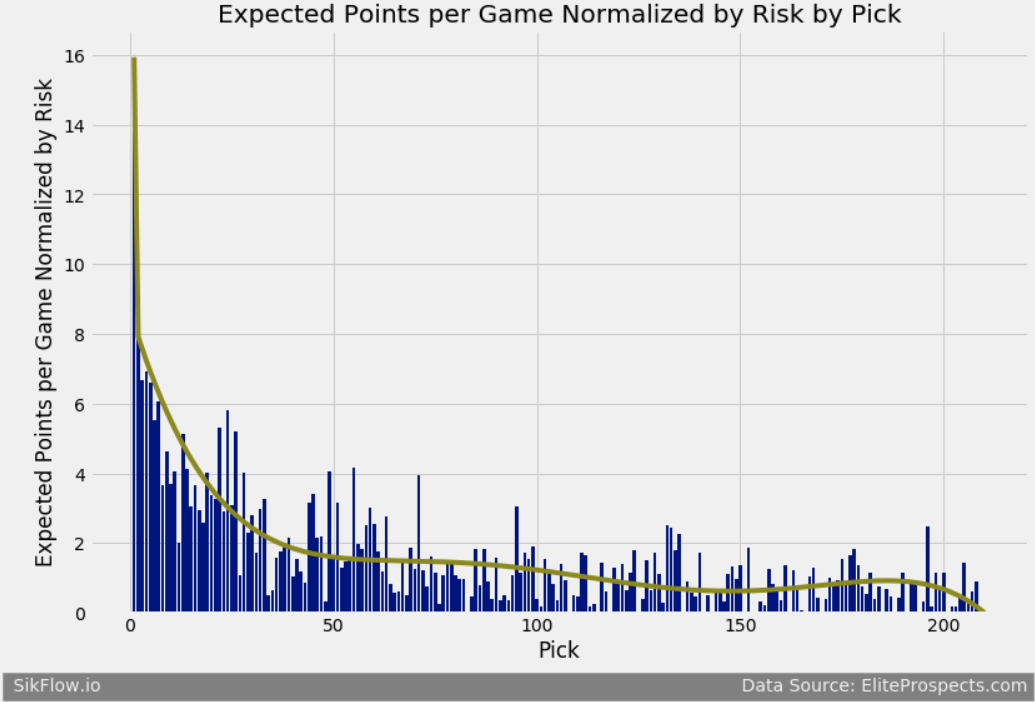
We see that the line smooths out some of the randomness, however we still see a little randomness at the end. As I expand the search this will smooth out. Now lets only look at only the first round. This model gives me a \(R^2\) of 0.77.
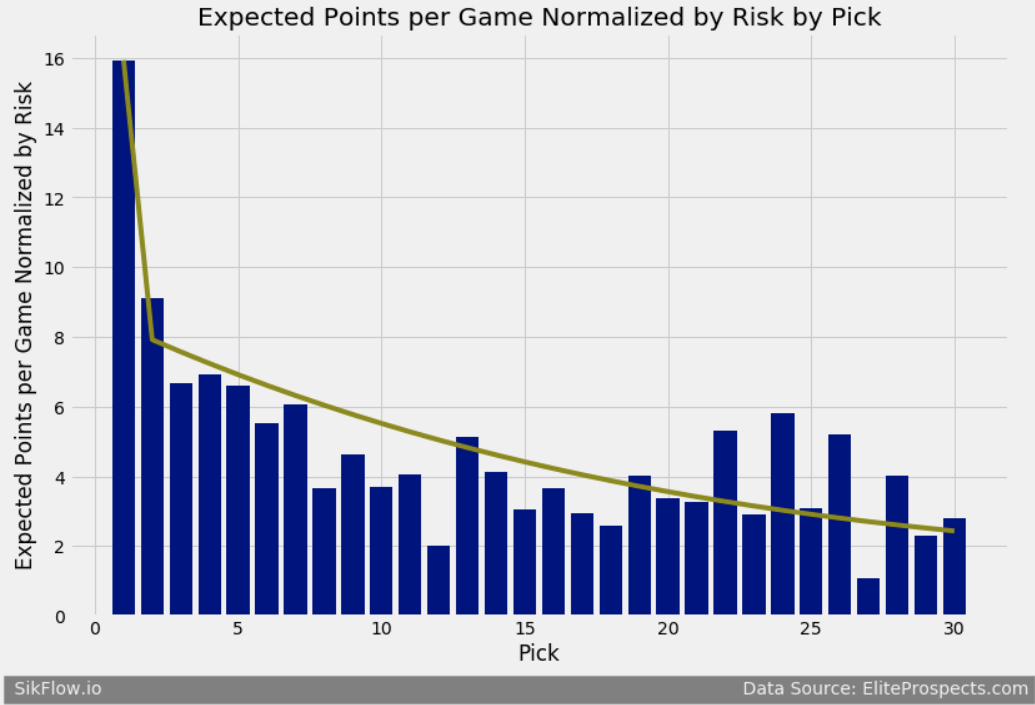
We see after the first overall selection, the expected normalized points is consistent. Here are the ratings for the first 30 selections
| Pick | Value | Pick | Value | Pick | Value |
|---|---|---|---|---|---|
| 1 | 15.94 | 11 | 5.28 | 21 | 3.42 |
| 2 | 7.92 | 12 | 5.04 | 22 | 3.28 |
| 3 | 7.57 | 13 | 4.82 | 23 | 3.15 |
| 4 | 7.24 | 14 | 4.62 | 24 | 3.03 |
| 5 | 6.92 | 15 | 4.42 | 25 | 2.91 |
| 6 | 6.61 | 16 | 4.23 | 26 | 2.80 |
| 7 | 6.04 | 17 | 4.05 | 27 | 2.70 |
| 8 | 6.04 | 18 | 3.88 | 28 | 2.61 |
| 9 | 5.77 | 19 | 3.71 | 29 | 2.52 |
| 10 | 5.52 | 20 | 3.56 | 30 | 2.43 |
Key Takeaways
The number one overall pick is worth a lot and is probably being undervalued. If you have the means to trade for this pick, you should do it.