Clustering Correlated Matrix
I am going to show how to cluster your correlation matrix. This can give you some interesting insights about your data that you would not pick up on without clustering.
First, I am to load in the wine dataset from sklearn.
from sklearn.datasets import load_wine
import pandas as pd
wine = load_wine()
df = pd.DataFrame(wine.data, columns = wine.feature_names)
df['y'] = wine.target
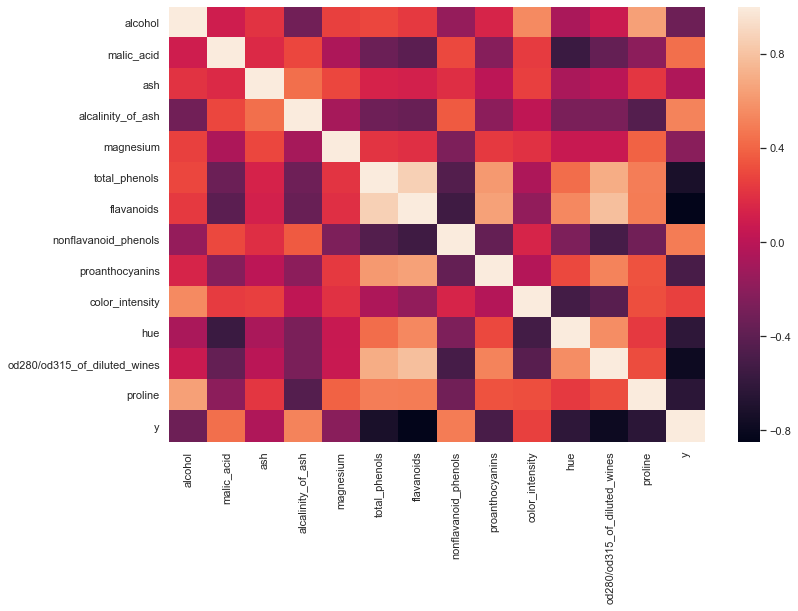
Now make a correlation heatmap with seaborn
import seaborn as sns
sns.set(rc={'figure.figsize':(12, 8)})
sns.heatmap(df.corr())
<matplotlib.axes._subplots.AxesSubplot at 0x1a2e261910>

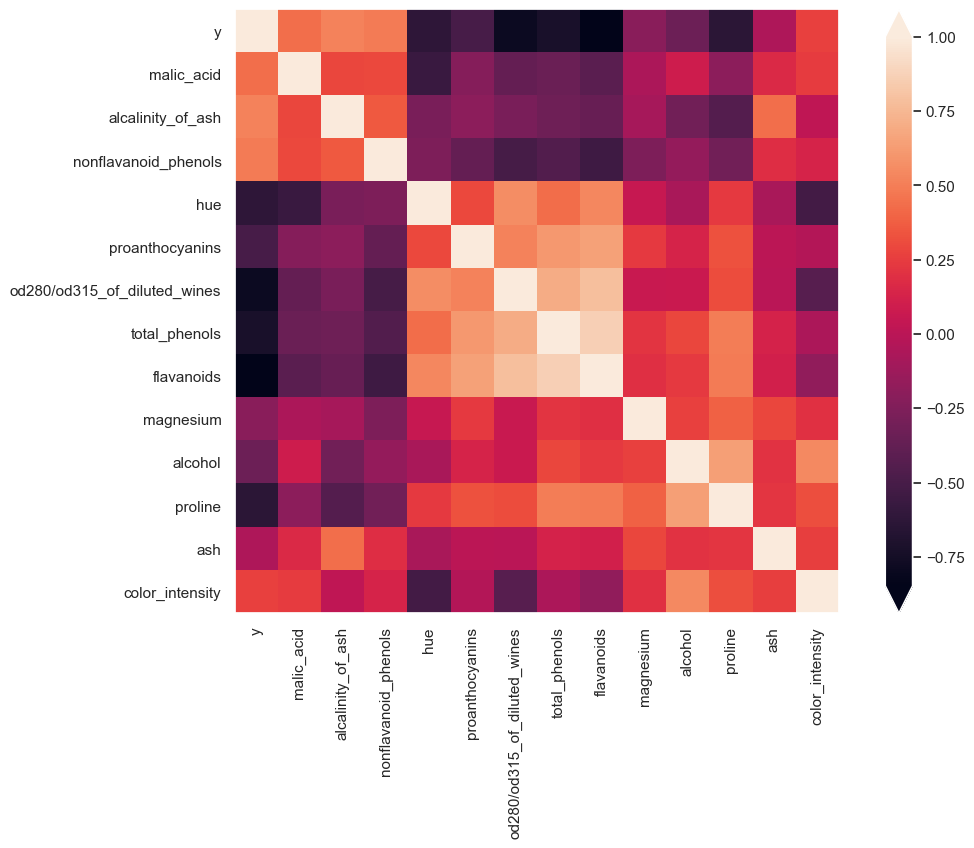
Now I am going to use a dendrogram to cluster the correlation matrix.
from scipy.cluster import hierarchy
import numpy as np
cor = np.corrcoef(df.T)
order = np.array(hierarchy.dendrogram(hierarchy.ward(cor), no_plot=True)['ivl'], dtype="int")
Plot using matplotlib imshow and order the matrix by the order specified by the dendrogram.
plt.rcParams["axes.grid"] = False
fig = plt.figure(figsize=(12, 8), dpi=100)
yep = plt.imshow(cor[order, :][:, order])
plt.xticks(range(df.shape[1]), df.columns[order], rotation = 90)
plt.yticks(range(df.shape[1]), df.columns[order]);
cbar = fig.colorbar(yep, extend='both')
#cbar.minorticks_on()

By ordering the data I can quickly see which variables are related to each other. For example hue, proanthocyanins, od280/od315_of_diluted_wines, total_phenols all have negative correlation with malic_acid, alcalinity_of_ash, nonflavanoid_phenols. We also see that there is a patch of features that are all highly correlated with each other.