Clustering - Image Compression with K-Means
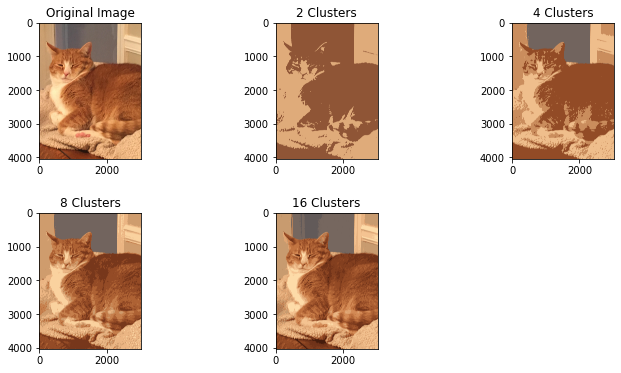
I’m going to use K-Means Clustering to compress an image. This process works by clustering the pixels together and then changing the pixels to be the cluster centers. To do this I will be using a picture of my cat Boogz.
from PIL import Image
import numpy as np
import matplotlib.pyplot as plt
from sklearn.cluster import KMeans

image = Image.open('boogz.jpeg')
h = np.array(image).shape[0]
w = np.array(image).shape[1]

new_images = []
for k in [2, 4, 8, 16]:
    kmeans = KMeans(n_clusters = k)
    kmeans.fit(np.array(image).reshape(h * w, 3))
    preds = kmeans.predict(np.array(image).reshape(h * w, 3))
    new_image = np.array([kmeans.cluster_centers_[x] for x in preds])
    new_images.append(new_image)
fig = plt.figure(figsize = (12, 6))

plt.subplots_adjust(hspace=0.4)

ax1 = plt.subplot(2, 3, 1)
ax1.imshow(np.array(image))
plt.title('Original Image')

ax2 = plt.subplot(2, 3, 2)
ax2.imshow(new_images[0].reshape(h, w, 3).astype(int))
plt.title('2 Clusters')

ax3 = plt.subplot(2, 3, 3)
ax3.imshow(new_images[1].reshape(h, w, 3).astype(int))
plt.title('4 Clusters')

ax4 = plt.subplot(2, 3, 4)
ax4.imshow(new_images[2].reshape(h, w, 3).astype(int))
plt.title('8 Clusters')

ax5 = plt.subplot(2, 3, 5)
ax5.imshow(new_images[3].reshape(h, w, 3).astype(int))
plt.title('16 Clusters')

We see 8 and 16 clusters look about the same as the original image. The table below shows the size of each image.
| Clusters | Size |
|---|---|
| 2 | 22 KB |
| 4 | 36 KB |
| 8 | 58 KB |
| 16 | 63 KB |
| Original | 78 KB |